- Global financial asset growth rises further to 7.7%
- Investment in securities makes a comeback – return of inflation makes bank deposits even less attractive
- Liabilities keep on growing – as concerns about the debt-bearing capacity
- Asia ex Japan: Financial assets’ growth slows down – but still the fastest of all regions
- Globalization reduces global wealth inequality – but increases domestic one
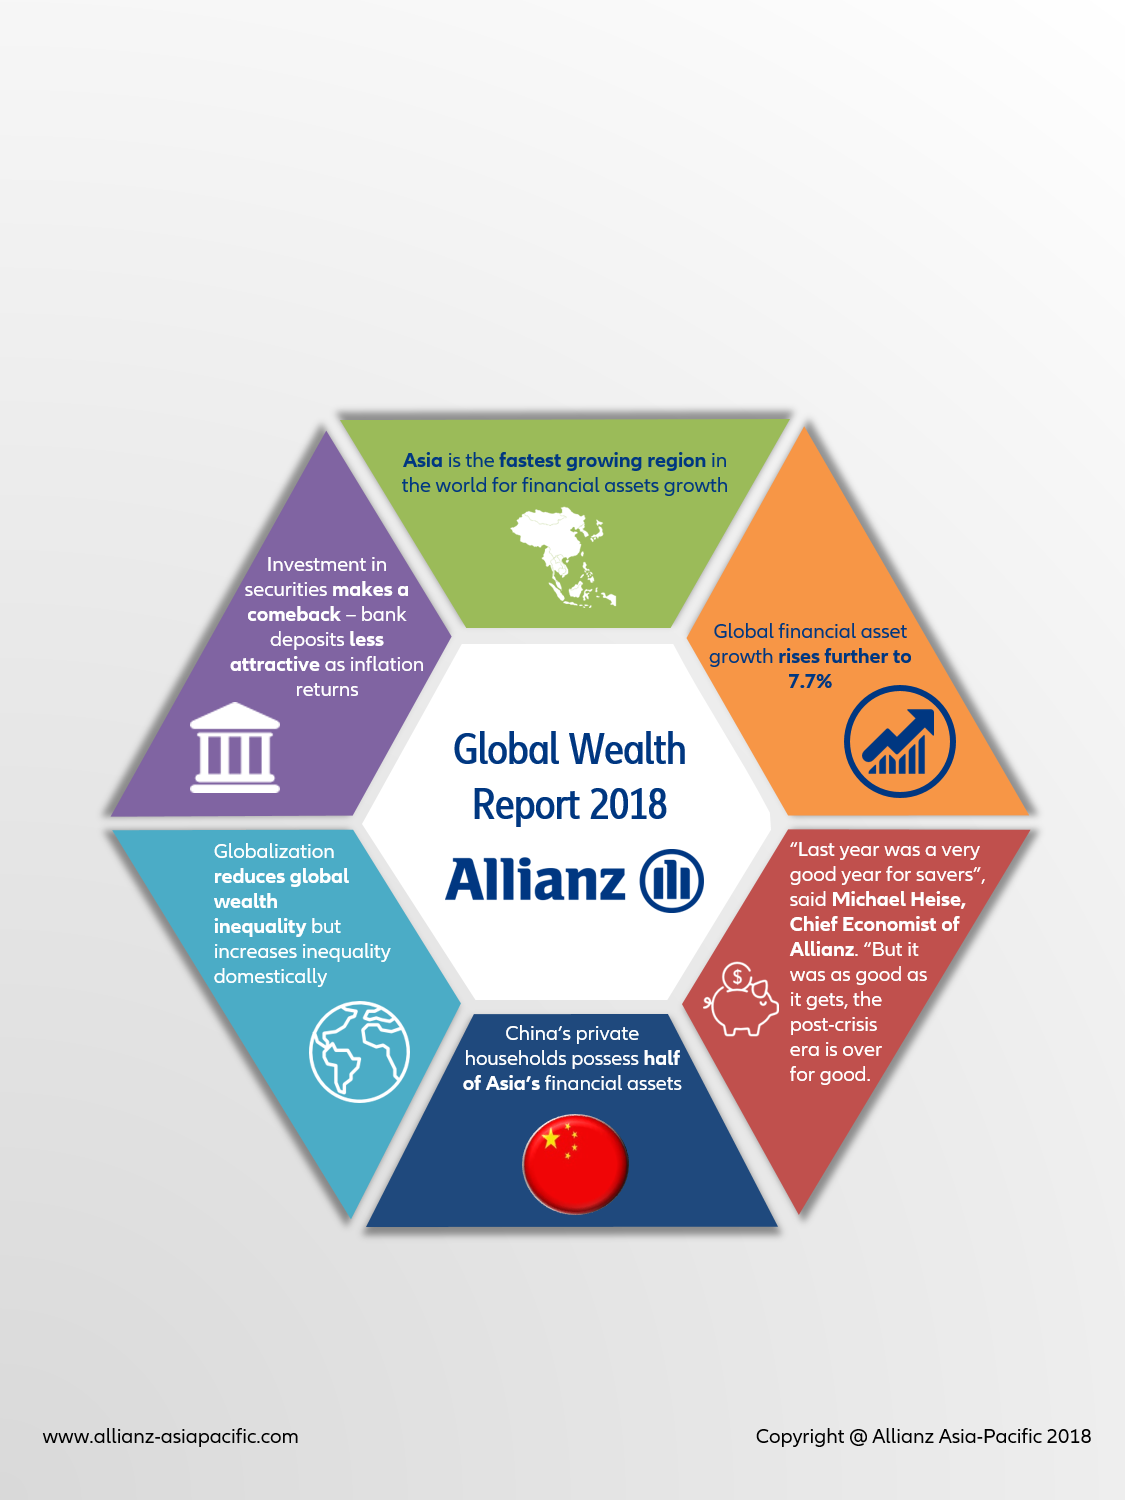
Asia, 26th September 2018 -- Today, Allianz unveiled the ninth edition of its “Global Wealth Report”, which puts the asset and debt situation of households in more than 50 countries under the microscope. 2017 was an exceptional year. Despite growing political tensions, it was an almost perfect year for investors. The economic recovery following the financial crisis culminated in a synchronous upturn around the globe and financial markets performed strongly, particularly equity markets. As a result, financial assets1 of households rose significantly by 7.7%. Global gross financial assets increased to EUR 168 trillion. “Last year was a very good year for savers”, said Michael Heise, chief economist of Allianz. “But it was as good as it gets, the post-crisis era is over for good. Gone are the times when an extremely expansive monetary policy provided for a continuous and steady upward trend on financial markets. The signs are already worrying: Rising interest rates, trade conflicts, and increasingly populistic politics cause tensions and turbulences. The first month of this year gave already a bitter foretaste.”
Asia ex Japan: Financial asset growth slowed down
In 2017, financial assets of households in Asia (ex Japan) increased by “only” 12.2%, the slowest increase in six years – but still the fastest increase of any region worldwide. Main “culprit” was China where growth cooled considerably; however, with an increase of 14%, it remained the most dynamic country of the region. All asset classes clocked slower growth than in 2016; but growth in securities – with a plus of almost 20% – and in insurance and pen-sions assets (9.5%) remained strong. Moreover, securities remained also the dominating as-set class in Asia’s private households’ portfolio, amounting to 46% of their total financial as-sets. Insurance and pension assets play still a minor role (portfolio share: 14%).
Growth in households’ debt moved more or less sideward, however on a high level, declining from 16.5% to 15.8% in 2017. As a result, the debt ratio climbed to 49.2%; this amounts to an increase of more than 10 percentage points in just five years. The main driver behind this increase in indebtedness is China. Net financial assets increased by 11.1%, the lowest increase since the financial crisis in 2008.
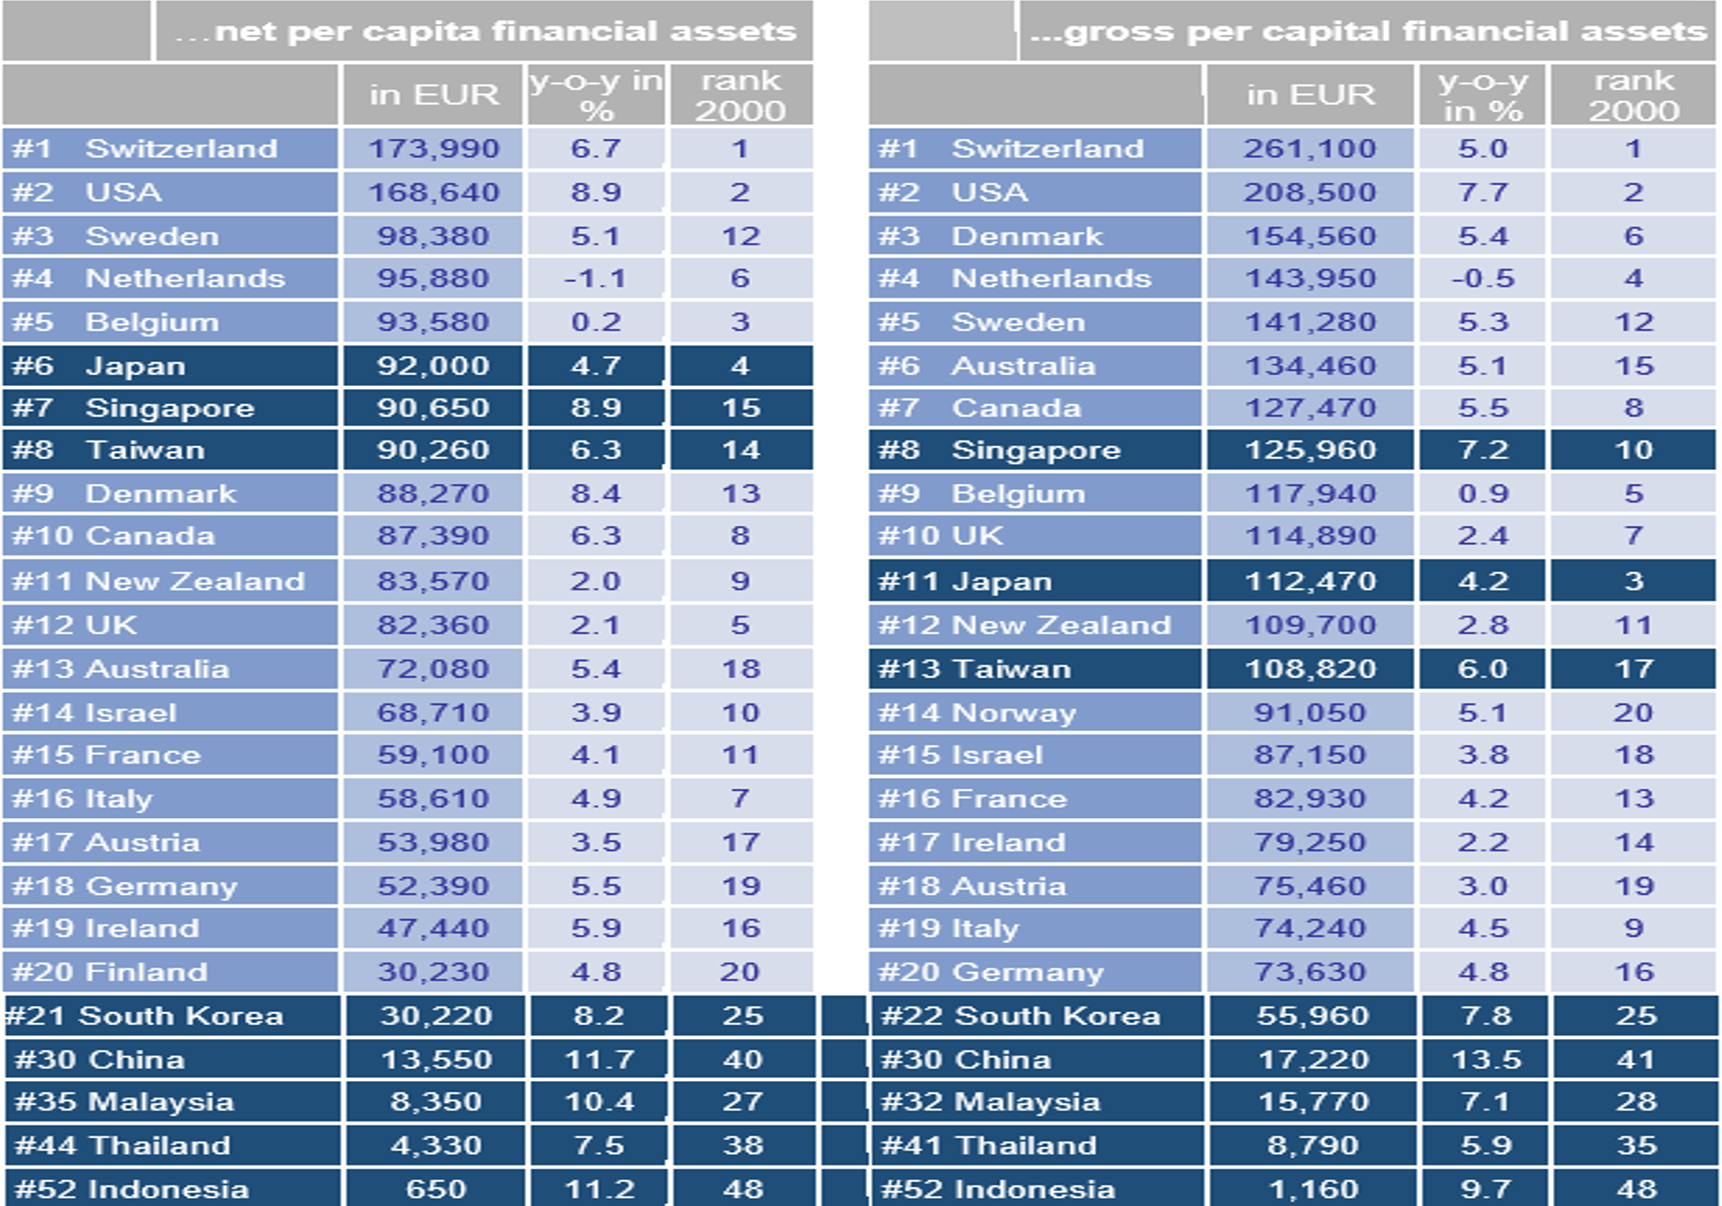
On average, net financial asset per capita reached EUR 8,220 in Asia (ex Japan), roughly at par with the average level in Eastern Europe’s EU members (EUR 8,970) but much higher than in Latin America (EUR 5,540). Besides Japan, two other Asian countries – Singapore and Taiwan – are in the Top Ten of the list of the richest countries (financial assets per capita, see table for the top 20); South Korea (at rank 21st in 2017) might enter the Top 20 very soon. At the top of the list, Switzerland re-captured the top spot that it lost the year before to the US. In general, European countries did in 2017 better than in previous years; this, however, reflects first and foremost a stronger euro.
The astonishing catch-up process in Asia becomes particularly clear in a long-term comparison, even if taking into account population growth and inflation. Real asset growth per capita was 10.5% in Asia (excluding Japan) in the last decade, twice as high as in Latin America (5.3%) and almost three times as high as in Eastern Europe (3.8%). Industrialized countries are falling far behind in this analysis, with 2% growth since 2007 in the US, 1.3% in Western Europe and 1.1% in Japan.
Industrialized nations catch up – the US overtakes China
The years following the crisis were mainly characterized by relatively weak asset growth in industrialized compared to emerging countries. This also changed in 2017. The acceleration in growth was due solely to development in industrialized nations: while growth in these countries increased by more than one percentage point to 6.5%, in emerging countries it slackened by three percentage points to 12.9%. The growth differential between these two groups of countries was thus at its lowest level since 2005, at 6.5 percentage points. The average figure for the past decade was twice as high, at 13 percentage points. This contrasting development when it comes to growth in financial assets was largely due to the respective heavyweights, China (where growth slowed from 18.3% to 14%) and the US (where growth accelerated from 5.8% to 8.5%). The US has thus overtaken China again in terms of absolute growth. In 2017, the US accounted for around 44% of global growth in gross financial assets of house-holds, while China accounted for only about 25%. This ratio has averaged 26% vs. 35% over the last three years – but with China coming out on top.
Investment in securities makes a comeback
There was a noticeable shift in investment behavior in 2017. After savers had largely ignored shares and investment funds in the post-crisis years, 2017 saw significant inflows into this asset class. Its share last year reached almost a fifth of fresh funds, even more than in the years preceding the crisis. In the context of booming stock markets, this meant that securities enjoyed by far the strongest growth of all asset classes in 2017, increasing by 12.2% in total and representing over 42% of all savings at the end of 2017. This is followed in second place by receivables from insurance companies and pensions, which account for 29% of the asset portfolio and grew by 5.2% last year.
While investors rediscovered the capital markets, bank deposits fell out of favor with house-holds around the globe. Only 42% of new investments went into banks, compared with 63% the year before. In absolute figures, this meant a drop of over EUR 390 billion. As a consequence, growth in deposits declined by two percentage points to 4.3% (share of asset portfolio almost 27%). “Savers finally recognized the signs of the times”, said Kathrin Brandmeir, co-author of the report. “The withdrawal of love for bank deposits, particularly in the “old” indus-trialized countries, came not a second too early. Because inflation staged a return. Price in-creases in these countries tripled in 2017 – albeit still on low level. As a result, losses in purchasing power of bank deposits shot up, too: They are estimated to add up to EUR 400 billion in 2017 alone.”
Debt growth accelerates further
Worldwide household liabilities rose by 6% in 2017. The growth rate was thus slightly above the previous year's level of 5.5%. Thanks to strong economic growth, however, the global debt ratio (liabilities as a percentage of GDP) increased only minimally to 64.3%. These global averages naturally mask huge differences. In some countries debt levels and dynamics have reached critical figures in the last few years. “In the majority of analyzed countries, private debt dynamics are not worrisome”, commented Michaela Grimm, co-author of the report. “However, in particular in Asia there are some countries – Thailand, Malaysia, South Korea and China for example – in which supervisory agencies should monitor the development very closely. In these countries, similarities to the credit excesses before the financial crisis can not be overlooked.” Despite the strong growth in liabilities, net financial assets i.e. the difference between gross financial assets and debt reached a new global record high of EUR 128.5 tril-lion at the close of 2017. This represents an increase of 8.3% compared with the previous year.
More participation thanks to globalization
The last two decades of rapid globalization have given rise to a new global wealth middle class, which included almost 1.1 billion people at the end of 2017. Fewer than half a billion people belonged to this group at the turn of the millennium, with just under half of them coming from Western Europe, North America or Japan. Today, these countries account for only a quarter of the global wealth middle class. In contrast, China's share has soared from just un-der 30% to over 50% in this period. The figures accompanying this success story are impres-sive: around 500 million Chinese people have moved up to join the ranks of the global wealth middle class since 2000, and over 100 million more can now even consider themselves part of the global wealth upper class. Thus today 62% of the global middle wealth class and 42% of the high wealth class are citizens of an Asian country.
More inequality in industrialized countries
The development of inequality in the national context, however, shows a very heterogeneous picture. Wealth distribution has improved in many countries since the turn of the millennium, but in many others it has deteriorated. The latter group includes a large number of industrialized countries, from the US to the euro crisis countries, and even Germany and Japan. The perception that the "old" industrialized nations in particular have been suffering in recent decades from a growing gulf between rich and poor therefore seems to match the reality in many cases. In Asia (ex Japan) the picture was also rather mixed, with some countries such as South Kore or Singapore with signs of an improving wealth distribution in recent years but others countries – Indonesia, Thailand or China – taking a turn to the worse.
A new indicator for the national distribution of wealth
To obtain a nuanced picture of national distribution in an international context, we have introduced a new indicator in this report, the Allianz Wealth Equity Indicator (AWEI). Some of the results are surprising. Along with the "usual suspects" of the US, South Africa, and the UK, countries where the distribution of wealth is relatively strongly distorted also include Denmark, Sweden and Germany. In Scandinavia this may be primarily due to high debt levels among large parts of the population; in Germany, the country's delayed reunification and the general shortage of capital-funded pension schemes play a crucial part. On the other hand, those countries where wealth distribution is relatively balanced include many eastern and western European countries, some of which are euro crisis countries such as Italy, Spain and Greece. Even if the last few years of crisis and austerity may have led to greater inequality in the last two countries in particular, they still have a relatively solid base to fall back on, as assets have traditionally been very widely distributed – not least when it comes to real estate assets. Asian countries can be found at the bottom of the list (Indonesia) as well as at the top of the list (South Korea). The region is much less homogeneous than often thought. “Our new wealth equity indicator shows clearly that we should be wary of drawing hasty or generalized conclusions” said Michael Heise. “Apart from the US, barely any country conforms to the cliché of wealth distribution that is already extremely distorted but is still getting worse. In most coun-tries, shades of grey prevail.”
Top 20 in 2017 by…
You can find the study on our homepage: Click here in the Publications/Specials section.
An interactive world map on households’ assets and liabilities can be found here
[1] Financial assets include cash and bank deposits, receivables form insurance companies and pension institutions, securities (shares, bonds and investment funds) and other receivables.