- Three time lucky: For a third year in a row, global financial assets grew by double-digits in 2021, reaching EUR 233trn (+10.4%)
- Turning point: In 2022, a nominal decline by more than 2% is on the cards - in real terms, households will lose a tenth of their wealth
- The return of debt: Household debt increased by 7.6% in 2021, the fastest increase since before the Great Financial Crisis (GFC)
- Asia remained the region of two speeds: In 2021, gross financial assets of Asia's private households increased by 9.4%
Singapore, October 12, 2022
Today, Allianz unveiled the 13th edition of its “Global Wealth Report”, which puts the asset and debt situation of households in almost 60 countries under the microscope.
The last hurrah
In retrospective, 2021 might have been the last year of the old “new normal”, with bullish stock markets powered by monetary policy. Households benefitted handsomely: For a third year in a row, global financial assets[1] grew by double-digits in 2021, reaching EUR 233trn (+10.4%). In these last three years, private wealth increased by a staggering EUR 60trn. This amounts to adding two eurozones to the global financial pile.
Three regions stood out in asset growth: Asia ex Japan (+11.3), Eastern Europe (12.2%) – and North America (+12.5%): As in the two previous years, the richest region of the world – with gross financial assets per capita amounting to EUR 294,240 against a global average of EUR 41,980 – clocked emerging market-like growth rates. On the other hand, Western Europe (EUR 109,340) behaved more like a mature, rich region, with growth at 6.7%.
Main growth driver was the stock market boom, contributing around two thirds to wealth growth in 2021 and propelling the asset class of securities (+15.2%). Fresh savings, however, remained elevated, too. Despite dropping by around 19% in 2021, with EUR 4.8trn they came in at still 40% above the level seen in 2019. The composition of savings, too, changed, albeit only slightly: Bank deposits’ share fell but with 63.2% they remained by far the preferred asset class of savers; on the other hand, securities as well as insurance & pensions found increasing favor with savers, but their shares in fresh savings were much smaller, with 15.5% and 17.4%, respectively. Reflecting these dynamics, global bank deposits grew by “only” 8.6% in 2021, still the second largest increase on record (after the 12.5% jump in 2020). Insurance & pension fund assets showed much weaker development, rising by 5.7%.
Turning point
2022 marks a turning point. The war in Ukraine choked the recovery post Covid-19 and turned the world upside down: Inflation is rampant, energy and food are scarce, and monetary tightening squeezes economies and markets. Households’ wealth will feel the pinch. Global financial assets are set to decline by more than 2% in 2022, the first significant destruction of financial wealth since the Great Financial Crisis (GFC) in 2008. In real terms, households will lose a tenth of their wealth. But in contrast to the GFC which was followed by a relatively swift turnaround, this time the mid-term outlook, too, is rather bleak: Average nominal growth of financial assets is expected to be at 4.6% until 2025, compared with 10.4% in the preceding three years.
“2021 brings an era to an end.”, said Ludovic Subran, chief economist of Allianz. “The last three years were nothing but extraordinary. It was a bonanza for most savers. Not only 2022 but the coming years will be different. The cost-of-living crisis puts the social contract to the test. Policy makers face the enormous challenge to master the energy crisis, secure the green transformation and spur growth while monetary policy hits the brakes hard. There is no more room for policy mistakes. Key for success are innovative and targeted measures at the national, and European unity at the supranational level.”
The return of debt
At the end of 2021, global household debt stood at EUR 52trn. The annual increase of +7.6% vastly outpaced the long-term average of +4.6% and 2020’s growth of +5.5%. The last time higher growth was clocked was in 2006, well before the GFC. However, due to the sharp increase in nominal output, the global debt ratio (liabilities as a percentage of GDP) even fell to 68.9% (2020: 70.5%). The geographic allocation of debt has changed since the last crisis. While the share of advanced markets is in decline – the US share, for example, dropped by ten percentage points to 31% since the GFC –, emerging economies account for an ever-rising portion of global debt, first and foremost Asia (excluding Japan): its share has more than doubled over the past decade to 27.6%.
“The sharp increase in debt at the onset of a global recession is worrying,” said Patricia Pelayo Romero, co-author of the report. “In emerging markets, households’ debt has increased with double-digit growth rates over the past decade, more than five times the speed seen in advanced economies. Still, overall debt levels seem manageable, but given the strong structural headwinds these markets are facing, there is a real threat of a debt crisis.”
Asia: Region of two speeds
Gross financial assets of Asia’s private households increased by 9.4% in 2021. The development was dominated by China and Japan, whose private households held 51% and 25% of the region’s gross financial assets respectively. While in China gross financial assets increased by 12.2%, Japan’s private households recorded a plus of 4.2%. If Japan is not included in the calculation, total gross financial assets rose by 11.3% in the region. But nevertheless, these two countries stand exemplary for Asia, that is still a region of two speeds: with emerging markets, where double-digit financial assets growth is mainly driven by backlog demand, like Cambodia, India, Sri Lanka and the Philippines for example, on the one hand and mature markets with less dynamic growth, like Singapore, South Korea or Taiwan, on the other.
Like in other parts of the world, securities recorded the strongest growth of all asset classes with 13.5%. Second in terms of growth were insurance and pension assets, which increased by 8.1%, and third bank deposits with a plus of 7.7%. However, the latter remained the dominating asset class in Asia’s private households’ gross financial assets portfolio with a share of 48.9%. Securities re-gained in popularity and accounted for 31.0% at the end of 2021, while the share of insurance and pension assets continued to decline to 18.4%.
“Early pension savings withdrawals and lowered pension fund contribution rates during the Covid-19 pandemic to ease the financial impact of the pandemic left a mark in private households’ asset portfolio. The consequences will only be felt in the long run, since many savers especially in the low-income bracket, will have difficulties to fill this gap by the time they reach retirement age,” remarked Michaela Grimm, co-author of the study.
While gross financial asset growth had slowed down slightly compared to the year before, liabilities growth accelerated to 10.3% in 2021. In the group of Asian countries except Japan loan growth was even higher amounting to 12.2%. This development was mainly driven by the ongoing price increases on the housing markets. At the end of 2021, the debt-to-GDP ratio in Asia reached a new record-high of 62.6%, excluding the debt of Japan’s private households it was only slightly lower with 60.6%.
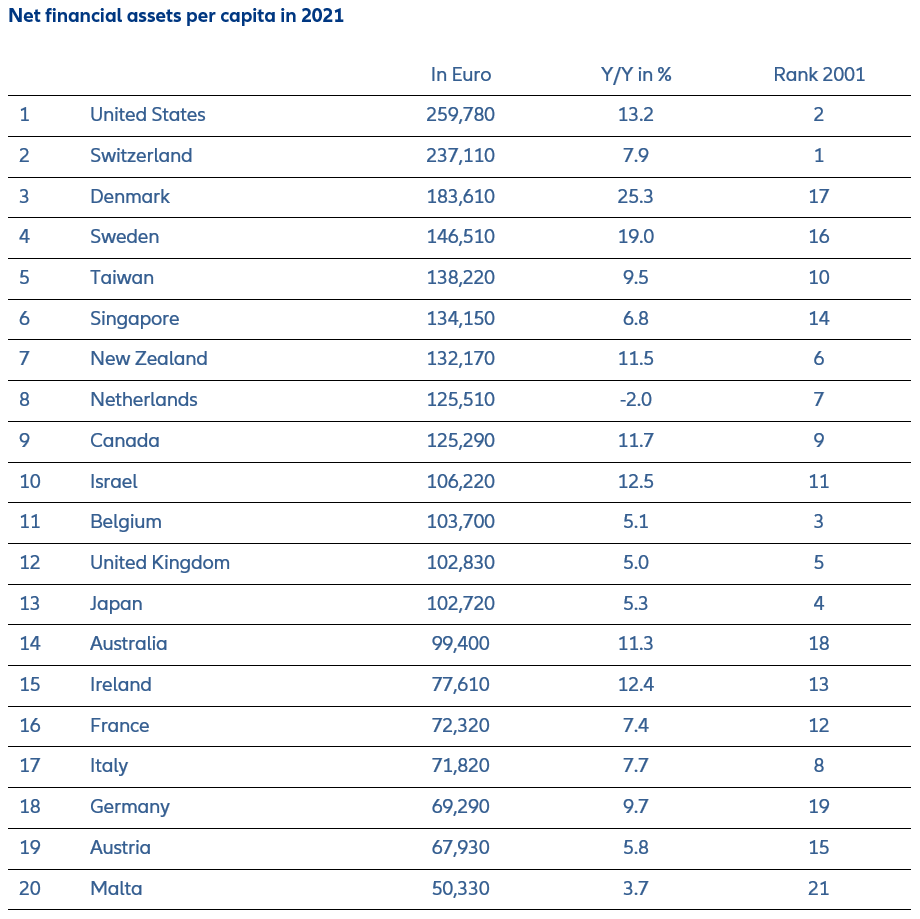
Net financial assets increased by 9.1% and thus was slightly weaker than gross financial assets since Asia’s private households’ liabilities had grown stronger than their gross financial assets during 2021. However, with Japan excluded from this calculation, net asset growth in the region was 11.0%. If Asia was a country, it would rank 36th in our ranking, with net financial asset per capita amounting to EUR 11,780, although three Asian markets, Taiwan, Singapore and Japan are among the 20 markets with the highest net financial assets per capita worldwide. However, on the other hand, five of the ten countries with the lowest net financial assets per capita in our ranking, namely Sri Lanka, the Philippines, India, Cambodia, Indonesia, and Pakistan, are also in Asia. In fact, if Japan’s private households net financial assets are not included, net financial assets per capita in the region do not even reach the EUR 10,000 threshold but amount merely to EUR 8,710 (financial assets per capita, see table for the top 20).
[1] Financial assets include cash and bank deposits, receivables from insurance companies and pension institutions, securities (shares, bonds and investment funds) and other receivables.
The interactive “Allianz Global Wealth Map” can be found on our homepage Allianz Global Wealth Map:
You can find the study here on our homepage
For further information, please contact:
Singapore: Noridahwati Razak, noridahwati.razak@allianz.com.sg, +65 9725 3865
Rebecca Chee, rebecca.chee@allianz.com.sg, +65 9641 5638